
Psychology
Innovating with infographics: Building health communication skills among undergraduate psychology students
This project involves the development, implementation, and evaluation of a novel assessment that builds digital literacy and health communication skills among online undergraduate students enrolled in Psychology of Health. Students synthesise research literature on health-related topics and then visualise that information through the creation of health infographics. To excel in the workforce, psychology graduates must communicate effectively across a range audiences and media. This assessment has real-world applicability, enhancing students’ confidence and employability by building their technology literacy and skills to communicate scientific information in a visual format.
Resources
These resources can be downloaded here and include:
1. Project Instructions
2. Project Rubric
3. Article Critique template
4. Article Critique rubric
Findings
Health communication is important to health practice and relevant for careers students may pursue after completing a psychology degree. However, although psychology undergraduate students are trained to communicate in traditional academic formats (e.g., research papers), they generally have limited opportunities to build skills to communicate scientific information visually. Through this project, we created a novel opportunity for undergraduate students to increase their digital literacy and visual communication skills in an online elective unit by creating a health infographic.
Infographics distil complex information into an easy-to-understand and engaging format and are increasingly used to communicate health information in public (e.g., public health announcements) and academic spheres (e.g., visual abstracts in peer-reviewed journals).
During two study periods (Summer 2020 and Winter 2021), this assessment was implemented in Psychology of Health, a third-year online undergraduate unit in psychology. The assessment involved two parts. First, students synthesised and critiqued empirical research on a health-risk or health-protective behaviour of their choice. Then, they produced an infographic. Students were introduced to the process of infographic creation over a series of weekly tutorials that covered the basics of visual communication design, introduced them to Adobe Spark, and invited them to share their infographic drafts with peers to receive formative feedback before submitting their final product. Along with their health infographic, students submitted a written reflection on their learnings from the assessment and the relevance of their learnings to professional practice in their aspirational career.
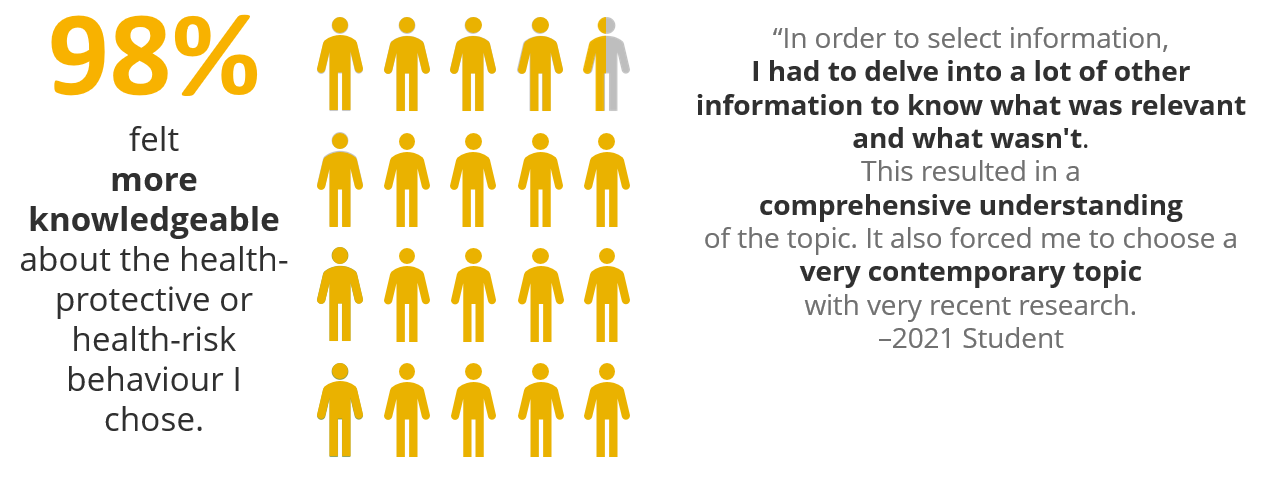
Given that use of infographics as an assessment task is innovative within psychology, we obtained ethics approval to evaluate this assessment. The prospect of creating an infographic stirred up a myriad of feelings among students. In a survey at the outset of two study periods, words like “anxious” and “curious” were used to describe how they felt as they looked ahead to the assessment. Following submission of the assessment, students shared that they felt “proud” and “inspired” as they looked back on the health infographic they had produced.
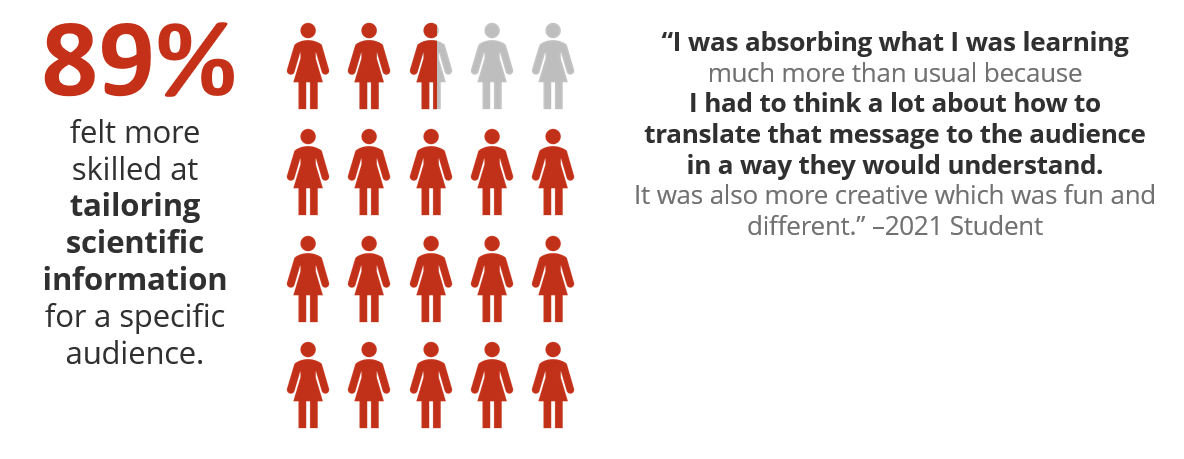
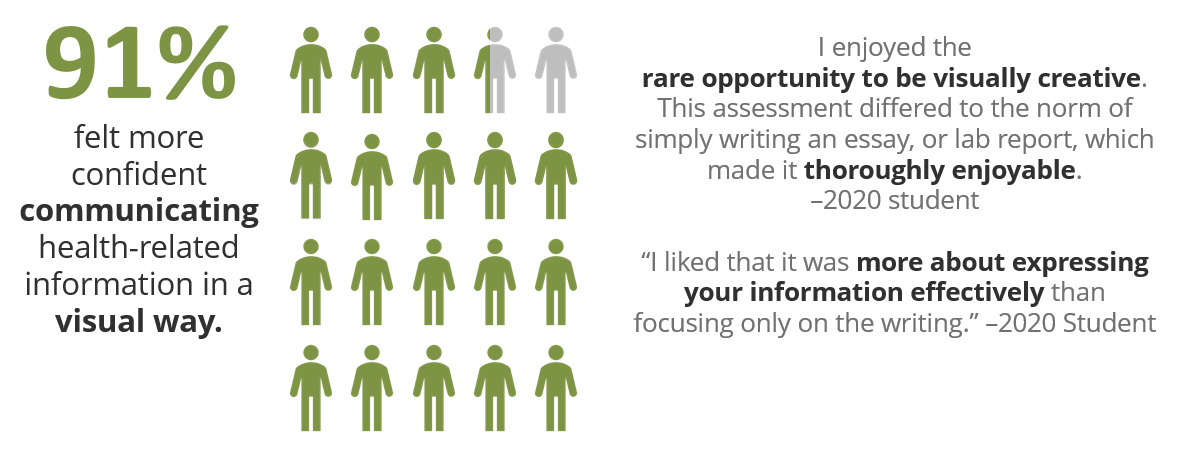
Of the 44 students who completed the follow-up survey across the two implementations of the assessment (52.3% response rate), 84% agreed or strongly agreed that infographic creation is a relevant skill for psychology graduates, and 75% agreed or strongly agreed that learning how to create infographics about health and wellbeing may improve their employability., respectively. Eighty-two percent of students indicated they would prefer to create an infographic over a traditional academic paper. Of course, not all feedback was positive and we will continue to refine and improve the assessment over time in response to student feedback. For example, students are keen for more parameters concerning topic choice and more guidance in how to visualise data. In future runs of the assessment, we intend to integrate additional guidance on using Adobe Illustrator for this purpose.
Findings from the evaluation of this assessment will be presented at the 2021 Australian Psychology Learning and Teaching Conference. Exemplars of student work from 2021 will be celebrated in the 2022 Department of Psychological Sciences Research Showcase, a publication that presents our Department’s work to the Swinburne community, external collaborators, and industry partners.
Our learnings
We, as educators, were pushed beyond our comfort zone to develop and implement this assessment. Neither member of the teaching team has a background in design and in the first run of the assessment, we were novices alongside our students! Establishing a collaboration with Dr. Belinda Paulovich in the Department of Communication Design, receiving Adobe Innovation Grant support, and engaging the Swinburne’s Adobe Digital Coaches made taking this pedagogical risk possible!
The experience of creating this assessment has encouraged us to be open to using more innovative assessments in other psychology units, where there is a pedagogical justification. Knowing the support available (e.g., Adobe Digital Coaches, Learning Transformations Unit) and considering the positive student response to this project, we feel confident in pushing digital boundaries in our future teaching endeavours.