

Marketing
Professionally Visualise Business Solutions for Industry Clients’ Problems Using Infographics
Industry client projects enhance critical, cognitive and professional skills among university students (Leal Filho, Shiel, & Paco, 2016). However, the students often find it challenging to present the highlights of their complex business solutions professionally tailored to industry audiences (Herbert & Herbert, 2020).
Infographics could address the challenges in professional communication (Smiciklas, 2012), thus collect more effective feedback from the industry audiences as well (i.e., indirect measurement of effective industry projects).
This cross-unit project; Global Logistics and Supply chain management, and Marketing strategy and planning, help approx. 400 students use interactive features of infographics (Krum, 2013) through an existing group assignment.
Resources
Given the growing requirements of data visualisation, evidenced-based decisions and data driven decision making from the industry, this infographics-based learning activity is bound to develop students’ competencies in presenting critical information in a visually attractive and convincing manner, synthesising diverse range of critical information to facilitate data driven decision making and designing an overall operational dashboard for quick executive decision making. Using infographics, the students not only develop creative digital presentation skills but also, they enhance deeper cognitive, integrative and critical evaluation skills.
The following two projects have been designed to direct students to apply their knowledge to provide practical solutions to actual client problems.
• Visualising marketing solutions using infographics – includes a lesson plan, assessment criteria sheet, student samples and suggested learning activities!
• Developing a logistics and supply chain plan for a sports company – includes a lesson plan, assessment criteria sheet, student samples and a team charter template!
The above resources are also available on the Adobe Education Exchange!
Problem
Industry client projects enhance critical, cognitive and professional skills among university students. However, the students often find it challenging to present the highlights of their complex business solutions professionally tailored to industry audiences. Infographics could address the challenges in professional communication enabling students to collect more effective feedback from the industry audiences. Students need to bridge the gap, especially when they synthesise critical information in a dashboard type format in such a way that it facilitates any decision maker to form an informed judgement about the status quo of the problem situation, visualise key deviations and trends underpinning the problem, and to take effective decisions to address the problem at hand.
Project Overview
Development of assessments aimed at developing students digital, information and critical literacies is the main aim of this project. When implementing the project, the students from Global Logistics and Supply chain Management unit identify an ethically and sustainably sourced sport product and design an overall logistics and supply chain system to supply the product to a Sport Goods Business in Australia. Student teams write a report on their supply chain solutions. This assessment simulates a real world learning encounter for students to apply their knowledge in resolving actual logistics and supply chain issue involving demand estimation & forecasting, bill of materials, sourcing parts and components, distribution centre planning, warehouse planning, supply chain performance metrics and logistics arrangements.
Marketing strategy and planning unit utilises a student led-Industry project which is built on real-world sustainable business issue presented by an industry client. This group assessment culminates in a strategic marketing plan being written towards the end of the semester. This assessment provides the students with a hands-on experience of strategy formulation, planning, implementation, and control. The aim is to develop a student's analytical and creative skills in applying strategic decision-making frameworks when developing marketing plans. In both units, the students develop professionally designed infographics to present their sustainable business solutions for the industry problems.
The project requires the students to collect vital information regarding supply chain/strategic marketing/operations from multiple sources in many digital formats (audios, videos, text). They engage in desk research to collect information, review them and draw key learnings through a systematic analysis of the information. This involves collating, grouping information, observing key trends and developments pertaining to the business solution they wish to propose. The project is, therefore, instrumental in supporting them to collect and process complex information.This co-designed project enhances business students’ communication skills, digital literacy, (using infographics), information literacy (seeking rich information) and critical literacy (evaluating information). It facilitates the students to explore versatile features of infographics to visually present business solutions. The students are exposed to and uncover their ability to get familiarised with newer digital programs.
Digital Literacies Outcomes
Enhancing critical literacy, the project requires the students to assess supply chain/strategic marketing and operations of the chosen industry clients using high quality and reliable information collected. This involves taking an analytical distance when exploring the chosen firm’s official websites and other publicly available information (e.g., mission/vision statement, annual plans) and reflectively questioning the information published by the firm against other sources using supply chain modelling/strategic decision-making frameworks, they learnt about in each unit. The students are strongly advised to question the context of the information they refer to and assess the quality of the information. This involves paying attention to the information reporting sources, people, organisations, regulatory and ethical concerns and relevant other possibly intended audiences (i.e., customers, public, industry, media) and, other stakeholders the information shared with (i.e., government, not-for-profit organisations, activists, academics).
Enhancing digital literacy, the project requires the students to visualise their proposed business solution through infographics accompanying a business report. Using different features of infographics such as static, zooming, clicking, animated, video, and interactive are recommended to enhance active engagement with the data. This will motivate the industry audience to reflect on the nuances of meaning expressed by the students and provide the students with more effective feedback.
Impact Data
Pre-project survey showed more than 50% of the students in Marketing Strategy and Planing unit and 80% of the students in Global Logistic unit were not familiar with Adobe program:
Pre-project survey showed more than 50% of the students in Marketing Strategy and Planing unit and 80% of the students in Global Logistic unit were not familiar with Adobe program:
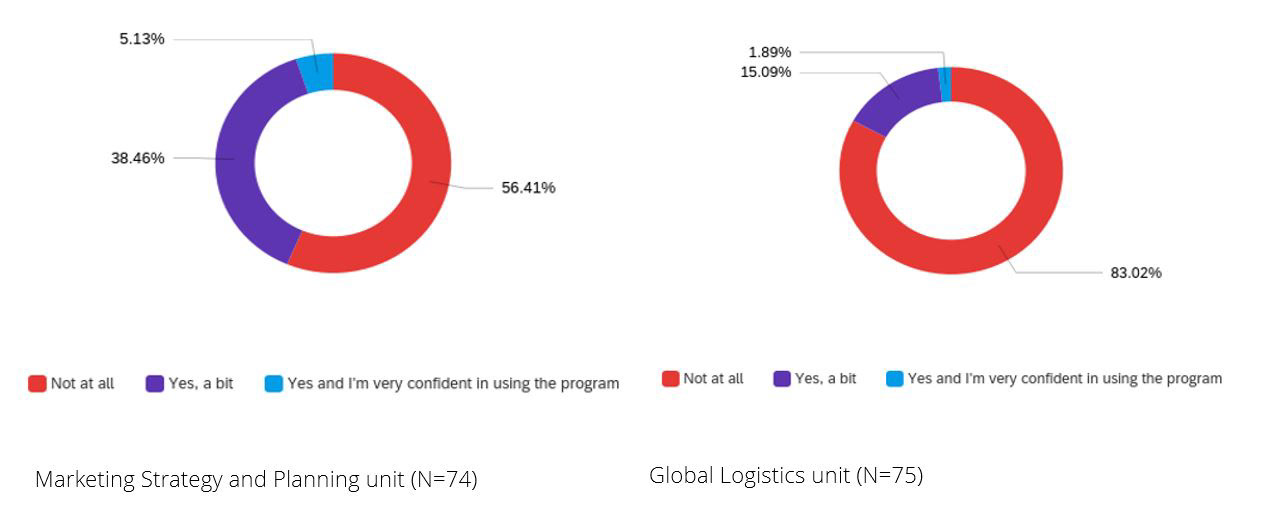
Familiarity with Adobe (Question: Have you previously used Adobe Express?)
Survey data collected towards pre and post project implementation reported increased confidence in digital literacy as shown below.
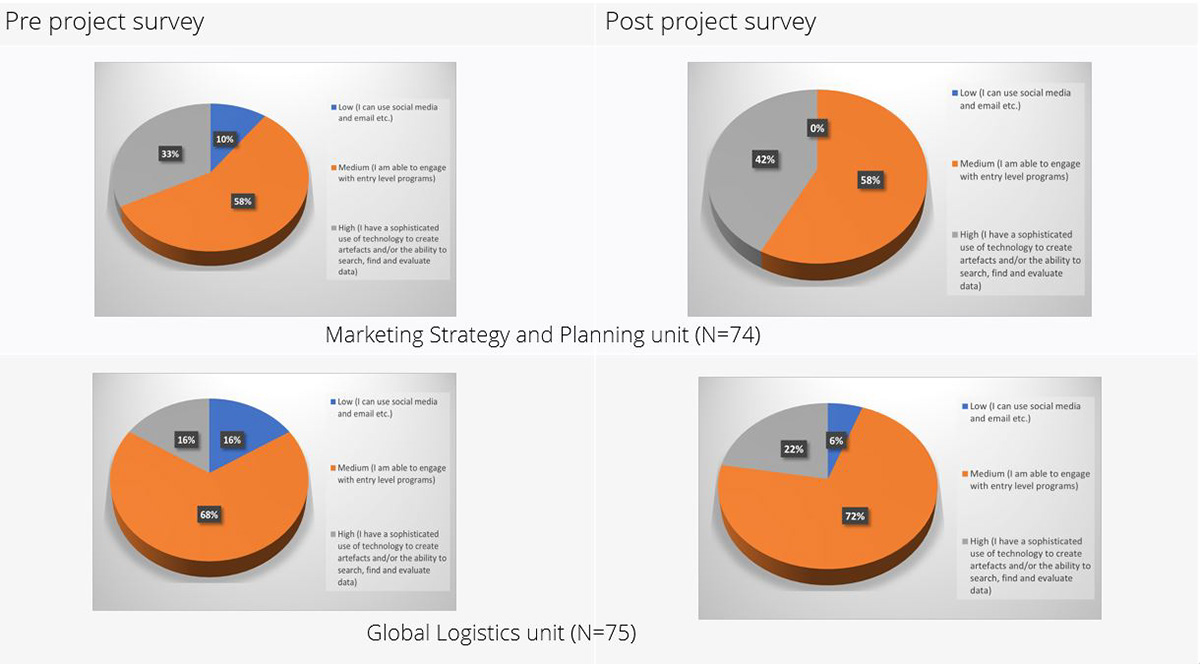
Increased confidence in digital literacy (Question: How confident are you with your digital literacy?)
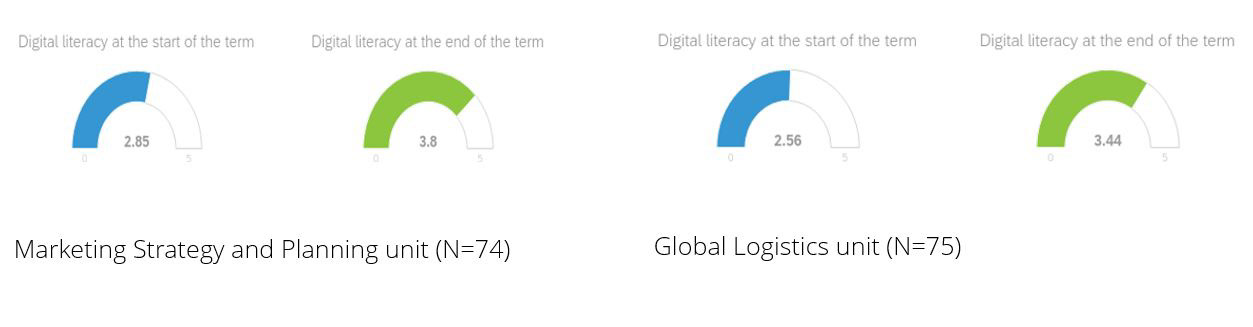
Increased confidence in digital literacy (Question: How confident are you with your digital literacy?)